


Adresse
1 rue de Saint-Petersbourg75008 Paris
Mail
contact@bam.techTéléphone
+33 (0)1 53 24 00 83The web has several tools, such as Google Lighthouse, to measure performance. But what about mobile apps?
This article will present a Flipper plugin we use to measure our React Native apps performance, with a concrete case of how we used it to bring our app performance to the top quality.
One of the key metrics to measure the performance of your mobile app is the frame rate. You want your app to run at 60fps (frames per second) to give an impression of smoothness.
This video from Google explains it well:
This is true for any mobile app, and so this is true for a React Native app as well.
But there's an added complexity: you also have to take into account the JS thread
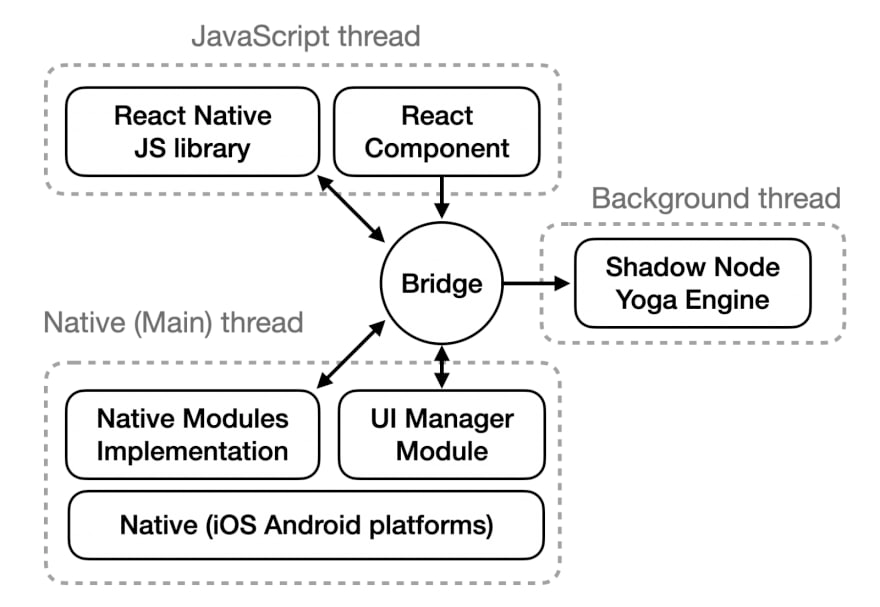
The JavaScript is driving the UI, so if it's not performing well, especially if it goes down to 0, your app will start to feel or be unresponsive.
For instance, if a user presses a button on your app:

But if your JS thread goes down to 0, this means it's using a CPU at max capacity already for other calculations and can't possibly handle your ++code>onPress++/code> at the moment.
You can find more details in the React Native docs (https://reactnative.dev/docs/performance#what-you-need-to-know-about-frames)
React Native provides the Perf Monitor out of the box (you can enable it from the React Native development menu on your Android device)

But since you only see the values at a given moment, it might be tricky to assess how your app is performing, or if some changes you make actually impact the performance.
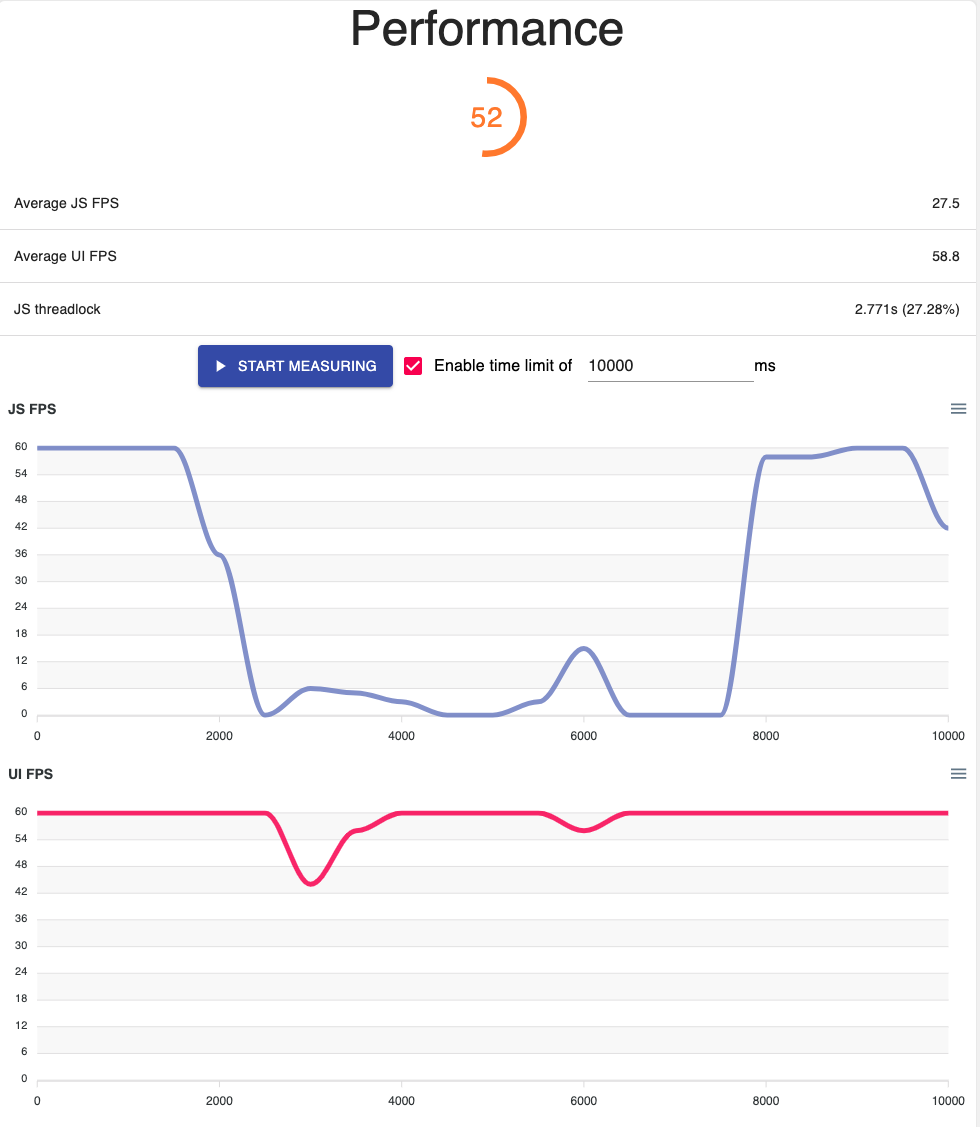
This is why we created a flipper plugin to profile those FPS data over time: https://github.com/bamlab/react-native-performance

As an added bonus, it gives you a performance score, aiming to be similar to Lighthouse for the web.
This is how the score is calculated below, quite naively, but open to suggestions:

Here is how to make the most of this plugin for your app. You'll also see how we used it in conjunction with the React Devtools to find and solve some performance issue in our app.
Often, developers (myself included) test their apps on high end phones or mostly in the iOS simulator.
But the easiest way to find performance issues is to try out your app on a lower end Android device. My advice is that you set the "minimum phone" for which you want your app to work smoothly. Measuring on this phone will accentuate performance issues but also performance improvements you might implement.

At BAM, we're using a Samsung J3 from 2017. This was one of the most sold devices in France in 2018.

It scores a measly103 in single score CPU performance on Geekbench.
It might seem bad compared to an iPhone 7 scoring 700 for instance. But on most of our apps, we're able to estimate that 15% of our users actually have a worse device in terms of performance (we compared metrics from Firebase performance to estimate this).
Improving performance is a way we, as devs, can fight against climate change
Measuring performance is tricky because it's never going to be 100% deterministic. So you should set measuring conditions in order to make your measures as deterministic as possible.
Luckily, the last point can be made easy on Android: it's indeed possible to script touch events with ++code>adb shell++/code> commands.
For instance, scrolling down on Android can be automated with a command similar to:
++pre>++code># adb shell input swipe <x1><y1><x2><y2> [duration(ms)]
adb shell input swipe 500 1000 500 0 50
++/code>++/pre>
The command above creates a swipe movement from the (500, 1000) coordinates, so the bottom of the screen, to the (500, 0) coordinates, so the top of the screen, during 50ms. Basically this will scroll down quite fast!
I invite you to try out running adb shell input and see everything that is possible for yourself:
++pre>
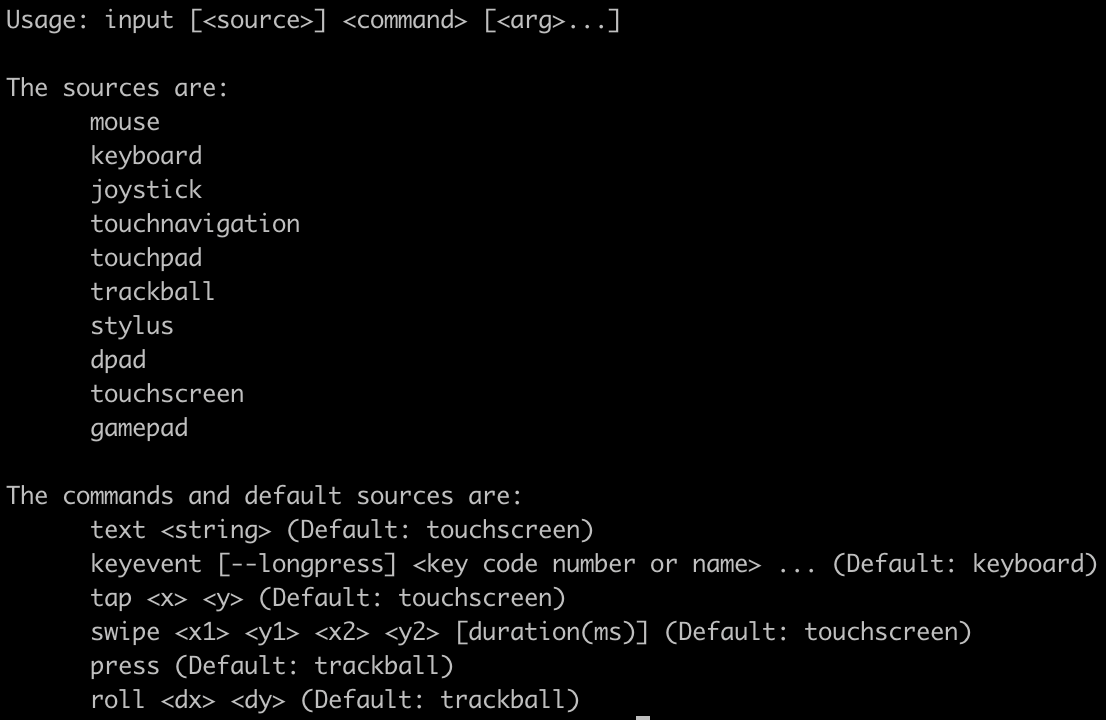
++/pre>
You can swipe, input text, click... on your Android phone, all from the command line! ?
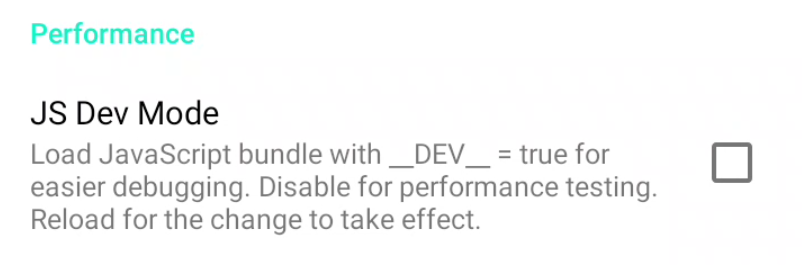
To measure performance, it's advised by the React Native devs to disable the JS Dev mode. To do so, open the development menu, and go to settings.
Otherwise, you might spot issues that won't be existing in the released version of your app.
If you have issues with:
TF1 is a French TV channel and while developing their news app, we wanted to ensure our performance was on par with our quality standards.
Our goal was to ensure that on our lower end Android device:
Below is how our team of 4 devs: Delphine, Antoine, Yang and myself iterated on our app to match our standards.
We measured the performance of scrolling on our Home page. It is implemented with a FlatList composed of several different components.

To measure: we use the Samsung J3 2017, our favourite lower end device and reproduce those steps:
Aaaand all our measures looked basically like this:

Needless to say, this wasn't acceptable. The biggest issue seeming to be on the JS side we went over to the React Devtools profiler in Flipper to analyze the cause of the issue.
The best tool to analyze JS issues is the React DevTools profiler, and you can open it from Flipper directly.
To make it show up, you'll need to re-enable the JS Dev mode.

The first thing you want to do is activate this neat option in the settings:
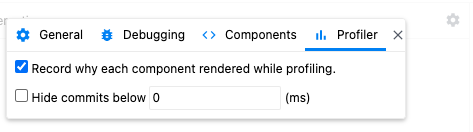
This will be useful pretty soon!
So for the TF1 Info app, we basically repeated the steps we did previously:
On the top right, you will see "commits". The React documentation is great at explaining how to make the most of it.
In our case, let's click on the most expensive commit, this is usually where you'll find your performance issue

Here's what it looks like:
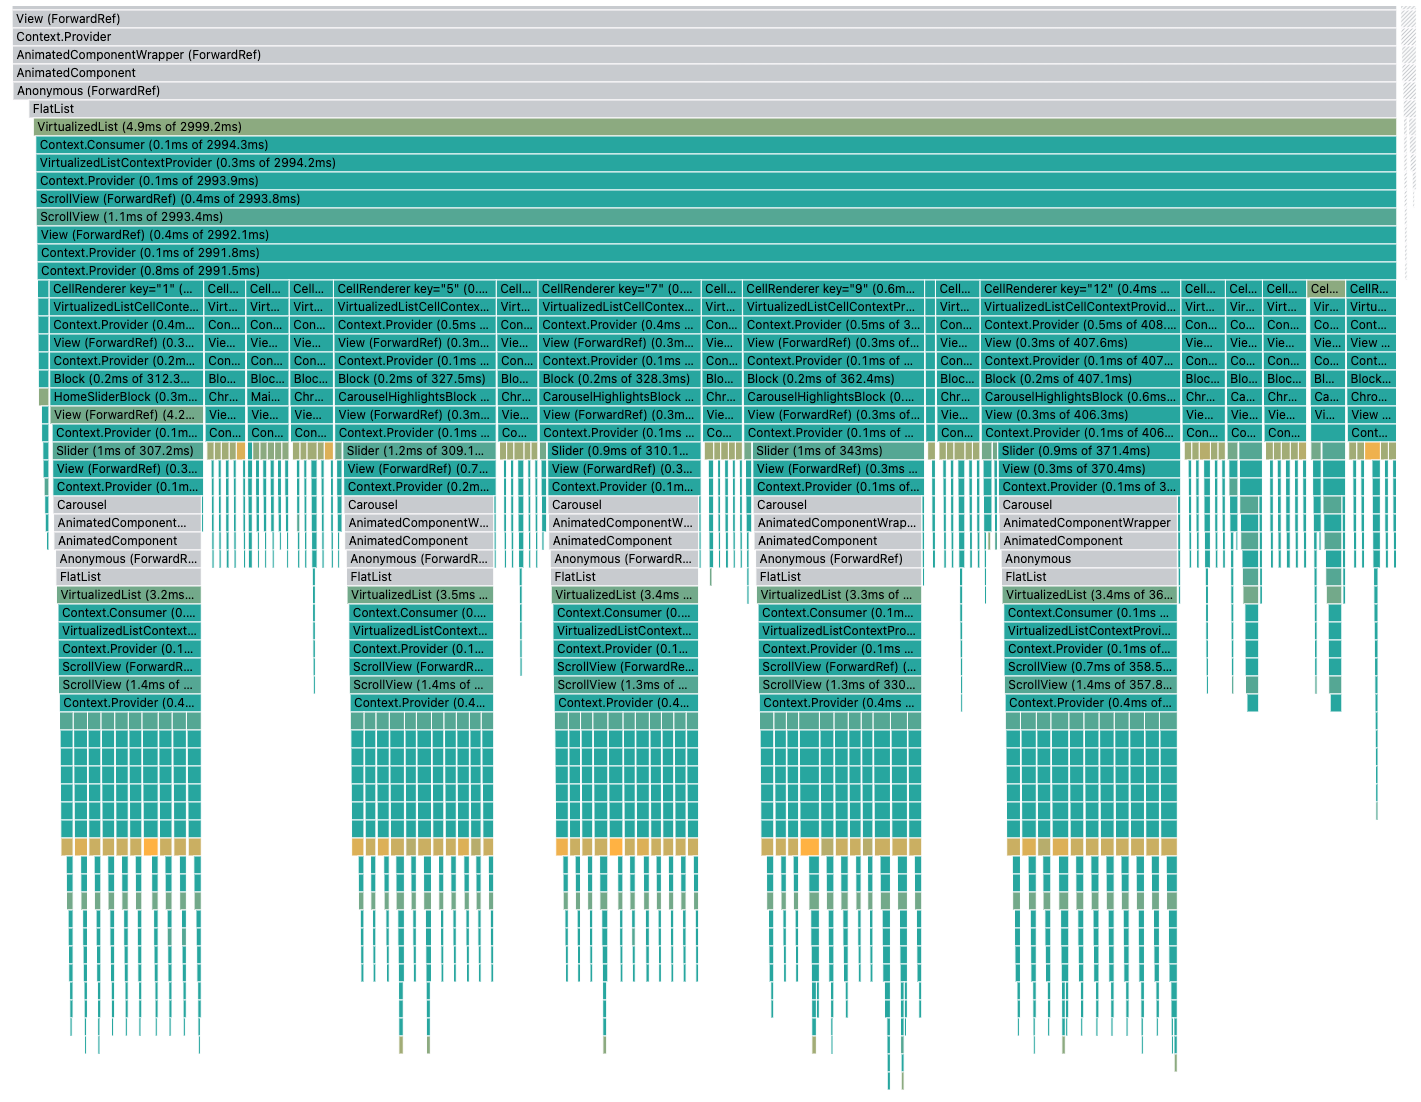
Everything that is gray is not rendering, so no issue there. The rest is rendering though!
The first non gray component here is the VirtualizedList (a direct child of FlatList), and it takes 2999.2ms to render!
What's crazy is that we can see that all of its children are rendering and it's quite expensive! ?
We'll see below the 4 iterations we made to improve our performance.
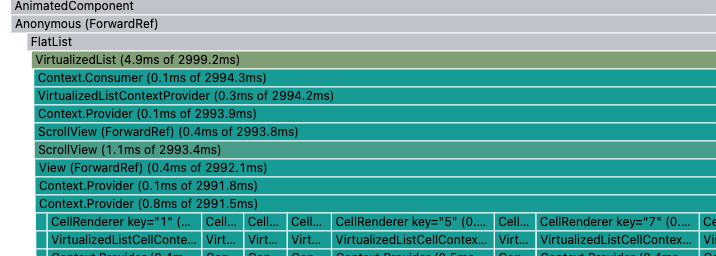
Under each FlatList, you can see its "CellRenderer" children. Each of those corresponds to an item in your list and will contain what you pass in ++code>renderItem++/code> (in our case a component called ++code>Block++/code>)
So here, we see that all of the items in the list seem to be rendering. We might think, that it is because when we scroll, new items appear and so they are rendered for the first time. That would be expected then.
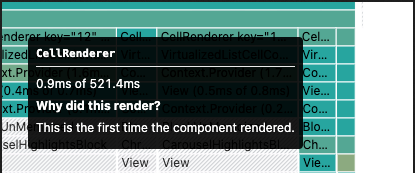
But by stepping over one of the CellRenderer, we can see it's not rendering because it's rendering for the first time, it's re-rendering because of props change. (We see this because of the option we activated before)
Sooo, when we scroll down, basically all items in our list seem to render?
Actually this is a common issue with ++code>FlatList++/code>. To be able to virtualize and not render the whole list of items, they're keeping a React Context of the "window" of items to be rendered, aka the first item index and the last item index that need to be rendered.
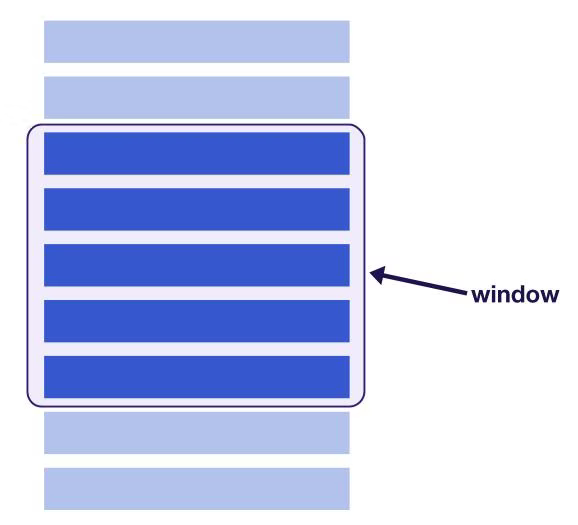
(Note that by default in a React Native FlatList, the window of items to render in your list has the size of 21 viewports, to ensure smooth scrolling. That was a lot more than I first imagined ?)
This means that when you scroll, your items are rerendered by design, because of the context change. So it's extremely important to follow good practices defined here. The easiest thing is to memoize the component you pass in ++code>renderItem++/code>.
Good moment to mention that I'm looking forward to the day where everything will be memoized out of the box in React, as teased in this talk.
Indeed, after memoizing, we can see some improvement.
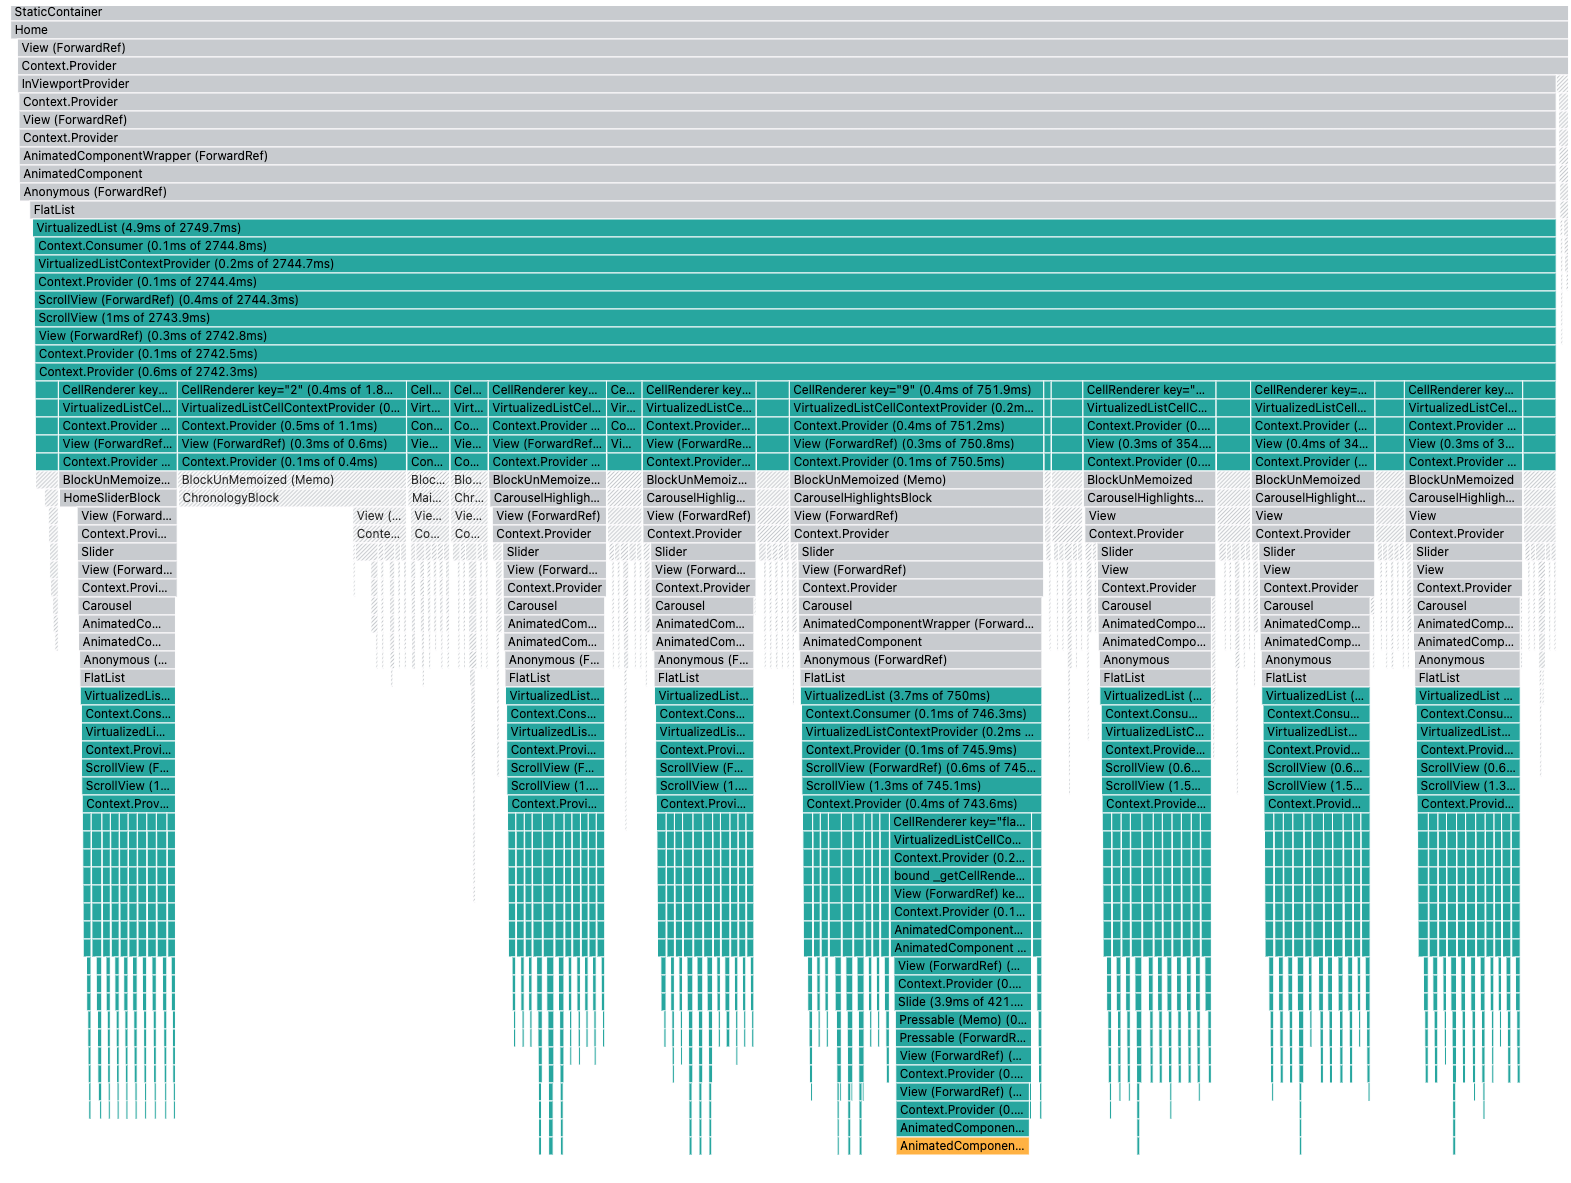
The biggest commit seem to be around 2.7s instead of 3s before. A lot more stuff is grayed out, which means less components are rendering. However, a lot of components (some children of our list items) still are rerendering while they ideally shouldn't.
Before moving to the next improvement, let's verify that we really did impact performance with this change, even if the JS Dev mode is disabled.
You know the drill, let's do the same measures as before with the performance monitor plugin.
This time, the measures looked like this:
Ok, so with a simple fix (just a well placed ++code>memo++/code>), we're already seeing some pretty good changes! ?
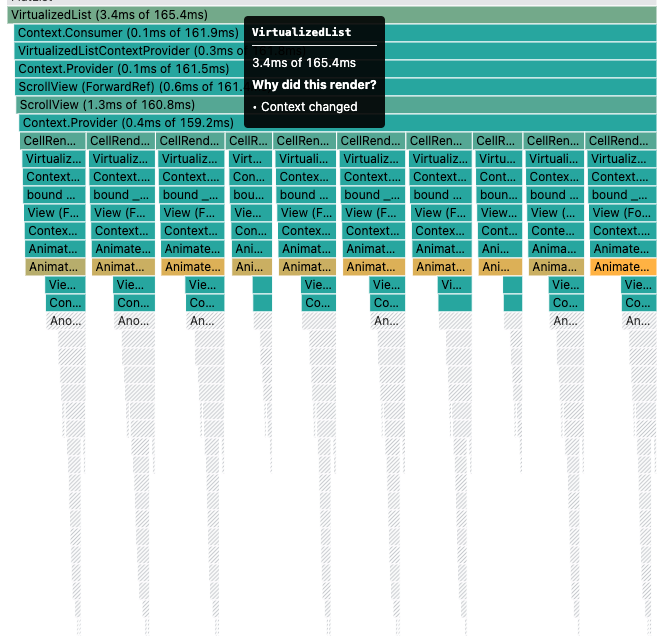
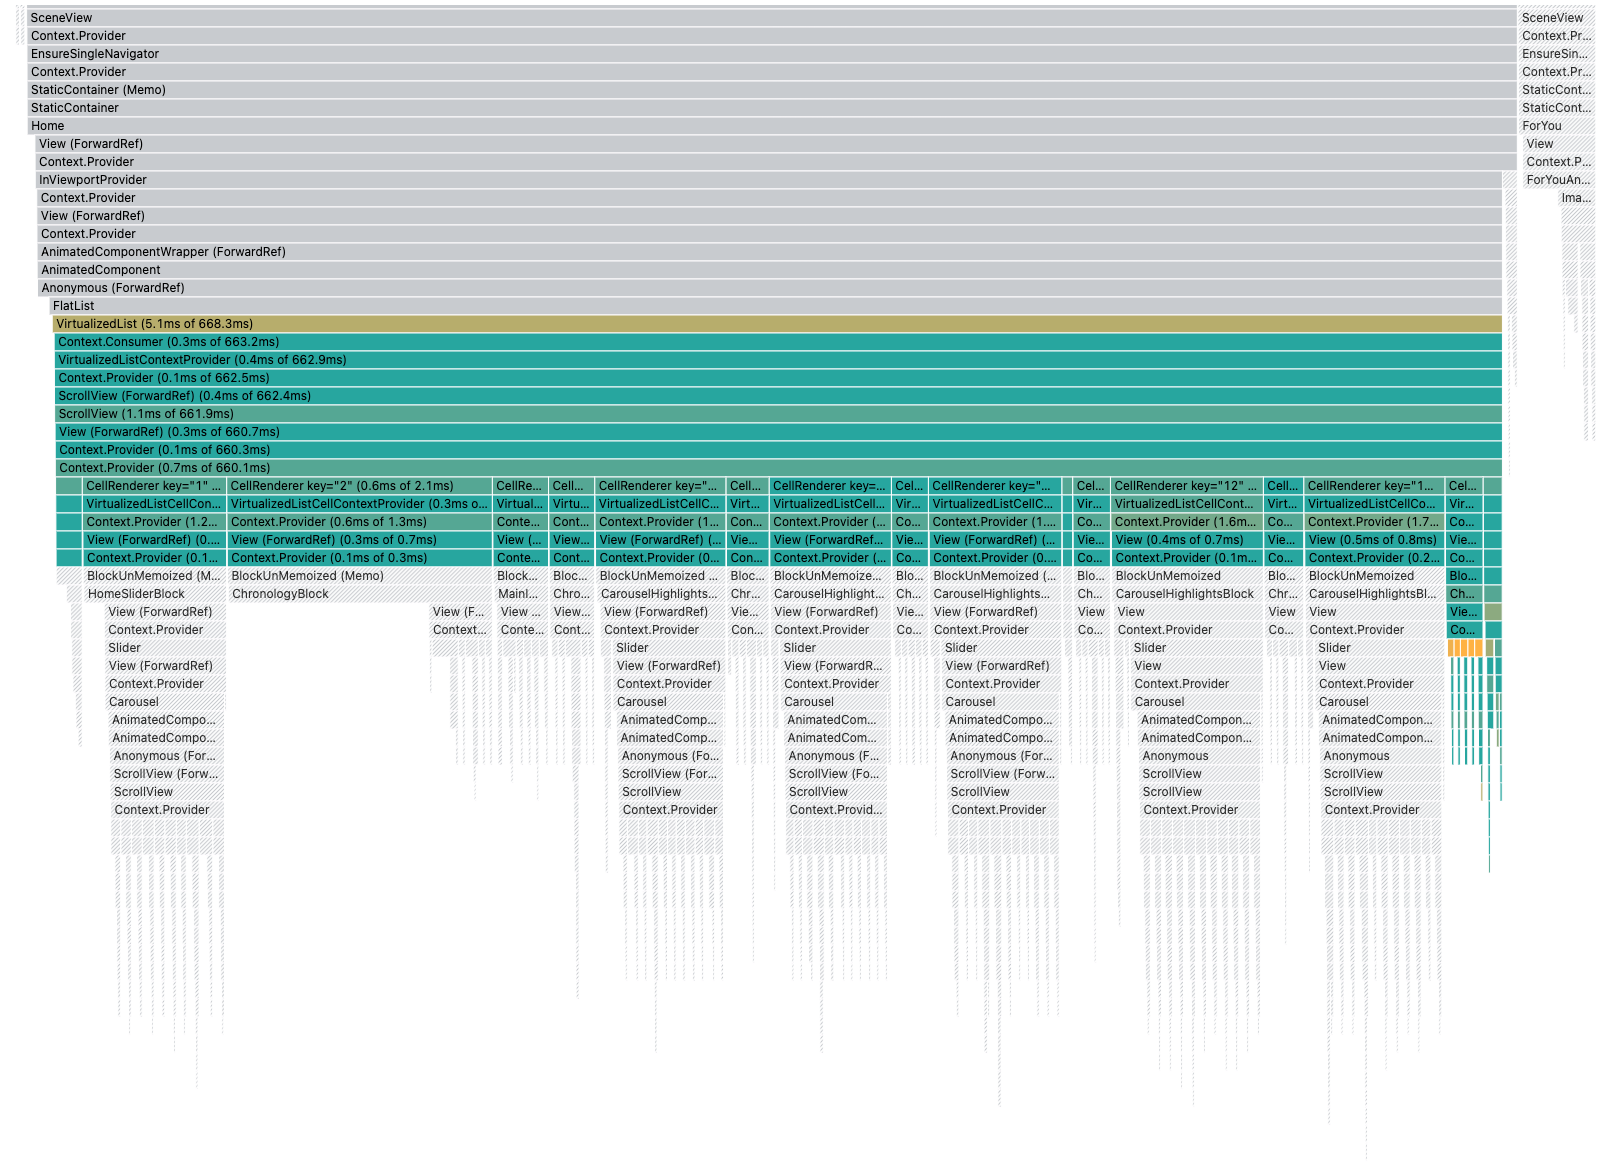
Bringing back the previous graph, as mentioned before, we can see that some items in the list are still rendering.
If we look closer we realize that nested ++code>VirtualizedList++/code> inside our vertical list items are rerendering.
Indeed we have horizontal carousels with react-native-snap-carousel and they use horizontal Flatlist. In the graph above, we see we have 7 carousels re-rendering (the 7 green columns basically), each having several items.

Well, remember the virtualization context window we talked about before? It also causes the nested virtualized list to fully rerender. And this is by design, because the nested Virtualized List virtualization window depends on the parent list virtualization window ?
What are we to do then if we have nested VirtualizedList? We can start by doing exactly the same thing as before and memoizing our nested list items. In our case, that would be the Carousel items.
Here's the result:

At first glance, not a lot has changed. We have new items rendering on the right, but they're rendered for the first time, which is to be expected when we scroll down.
But on the previous graph, all of the children of the nested lists were green and thus re-rendering. Here the children at the very bottom (our carousel items) are grayed out and not re-rerendered. So that seems like a nice improvement right?
Let's check the score on the performance monitor plugin with production JS:

Sadly, not of a lot of improvement here actually:
This brings us to our next iteration. Going back to the React Devtools, if we click on a nested list in particular (one of our carousels), here's what we see:
We can see that this carousel has 10 children re-rendering. But actually, when I check in the app, it only has only 4 items! ?
This is because we enabled the ++code>loop++/code> property on the carousel (see the prop doc) which works by adding 3 (by default) item copies at the beginning and at the end of the list.
This checks: 3 + 4 + 3 = 10 ?
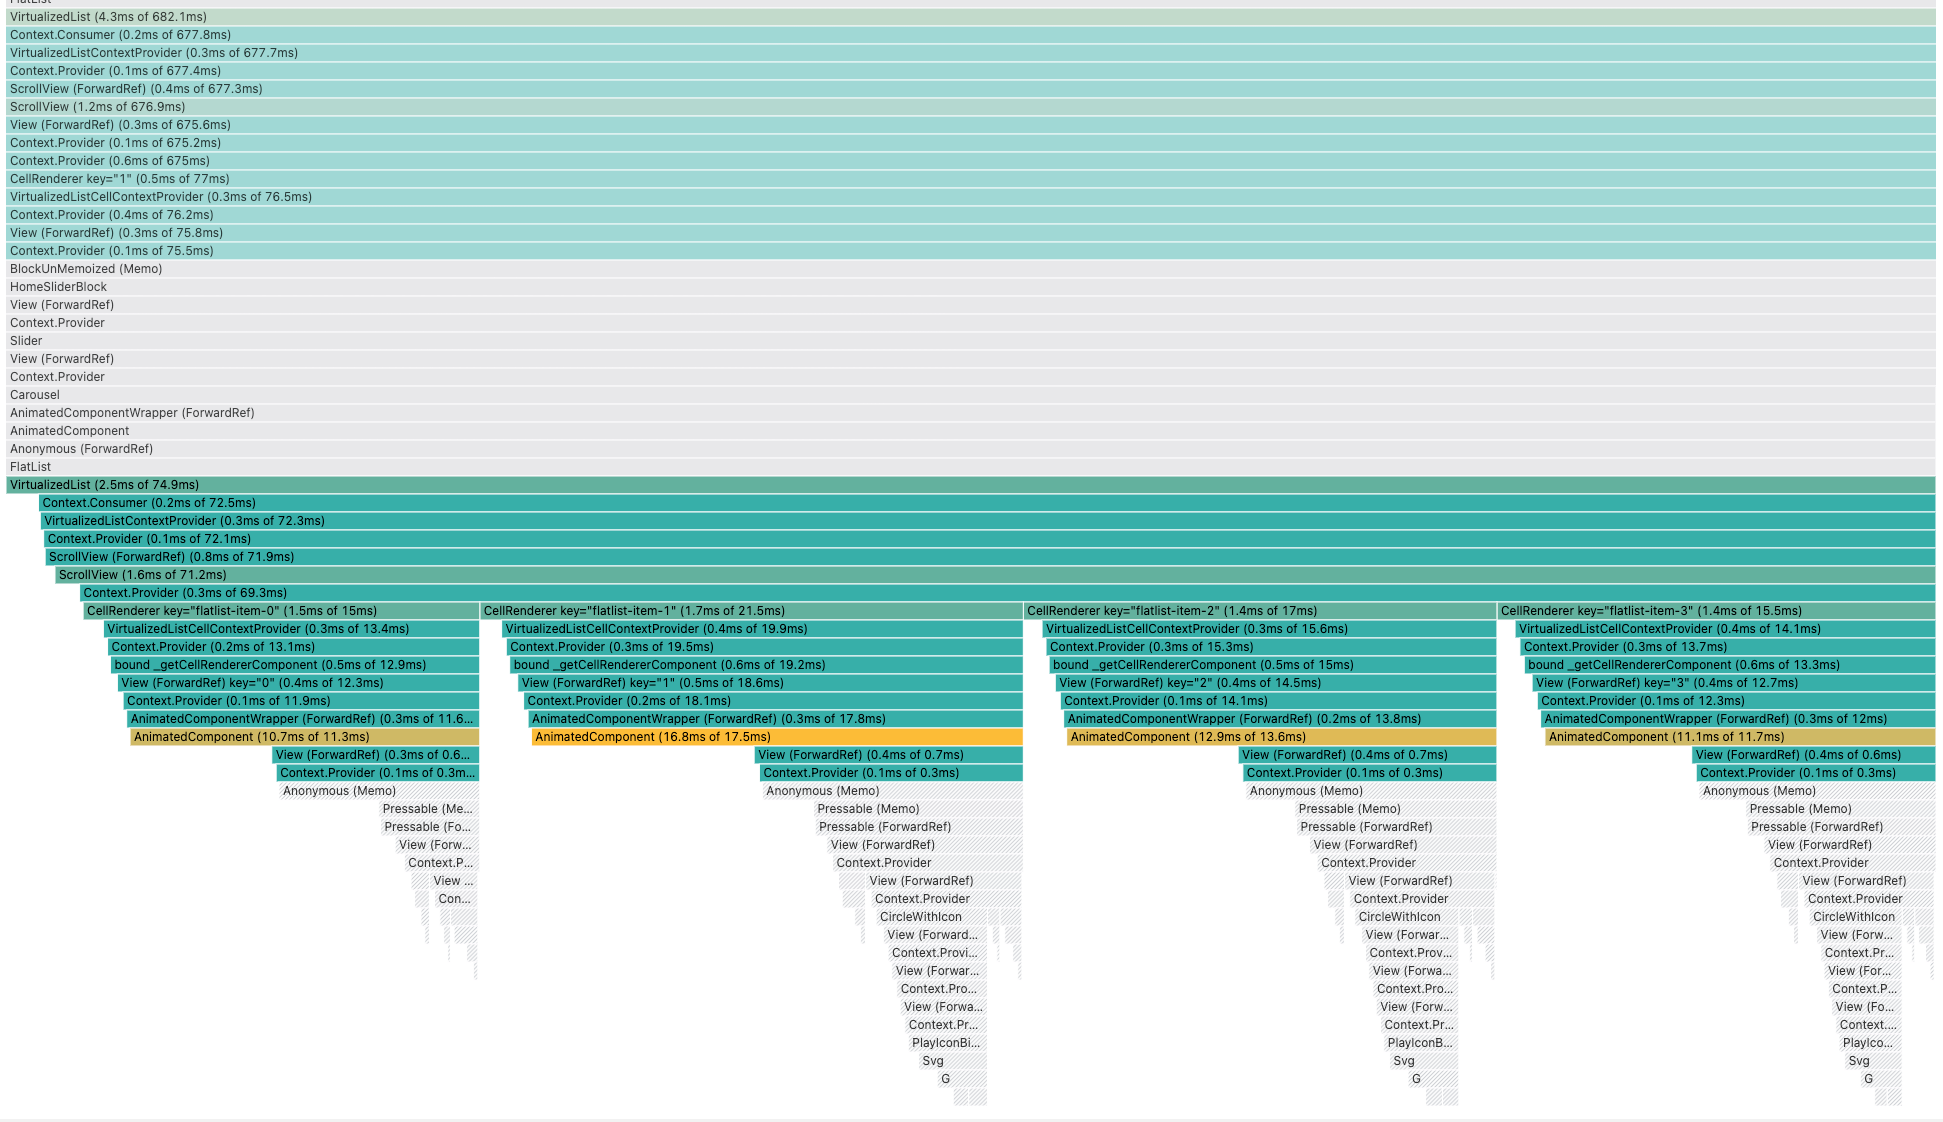
So we decided to remove this feature and check the result:
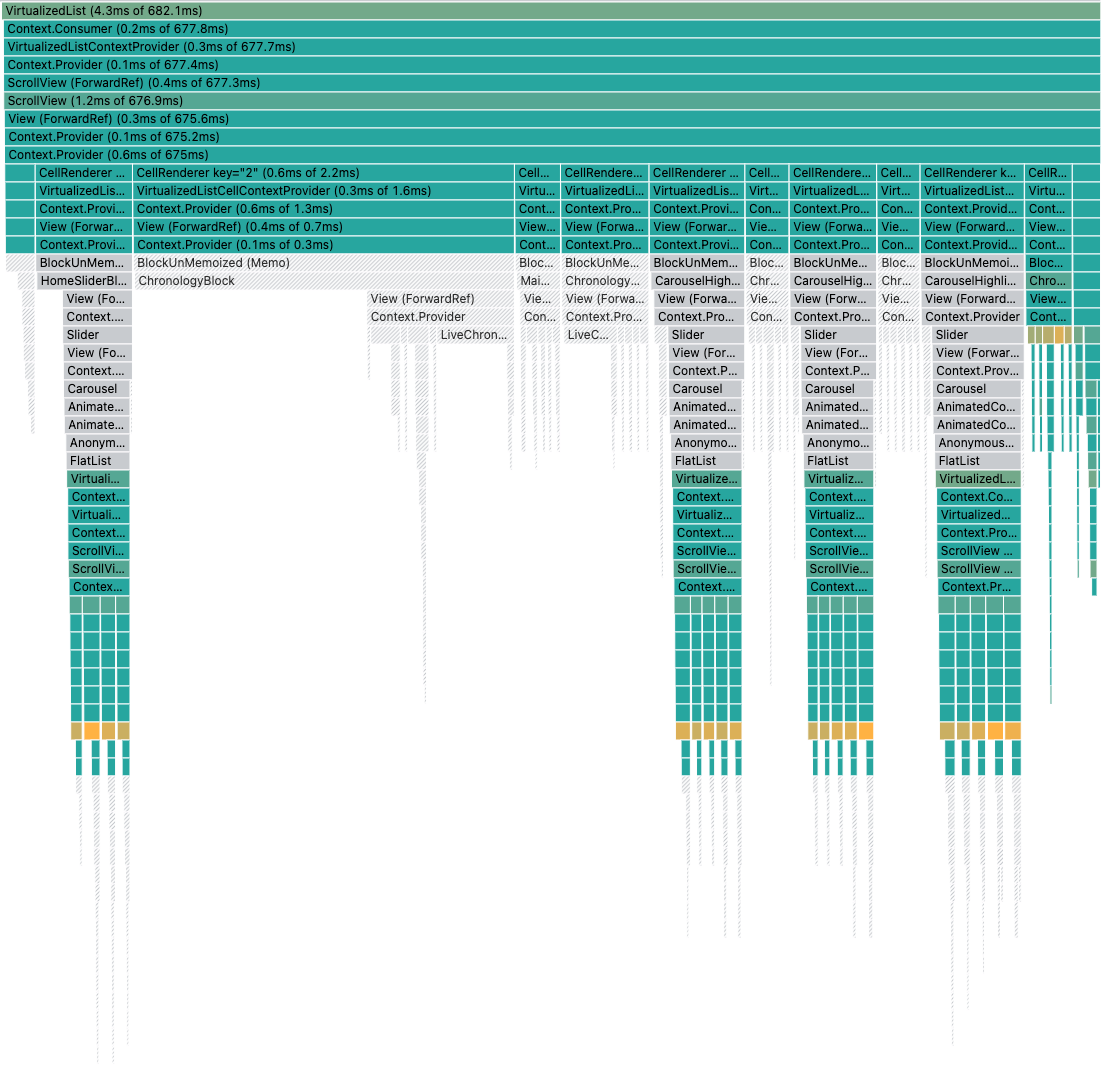
Quite nice, we have way less items re-rendering so our vertical list takes less time to re-render (only 682ms this time)
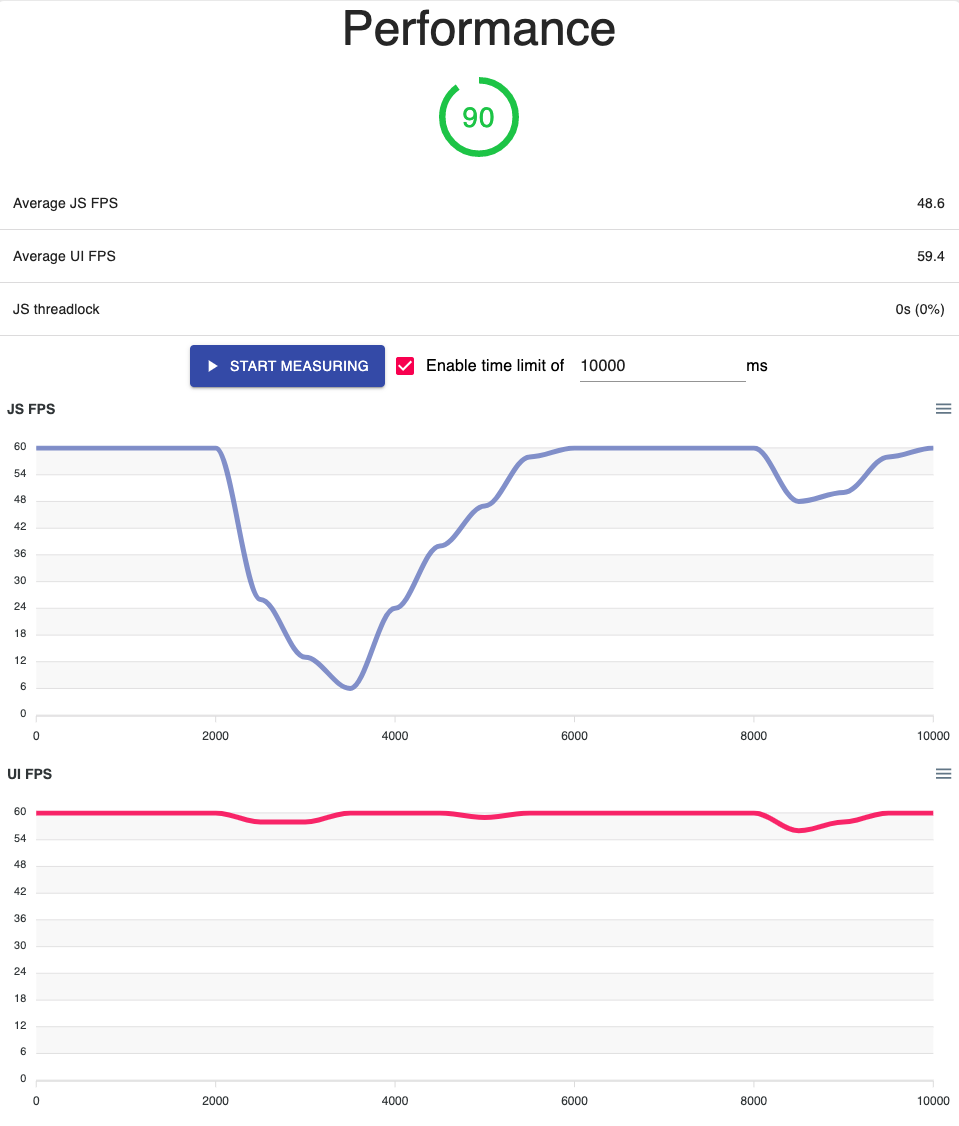
Let's check our score!

Great improvement this time ?
We're getting there, but it's still not great. The JS hitting 0 means that for 1s, the app will be unresponsive.
Going back to the previous Dev Tools graph, what's annoying is we sill have a lot of green. And even if we get rerendered per design of the virtualized list, we shouldn't have so many components re-rendering right?
Let's take a closer look at one carousel:
When scrolling down, we can see the 4 ++code>CellRenderer++/code> rerendering (as expected) but there's a lot happening between the ++code>CellRenderer++/code> and the actual Carousel items in our code.
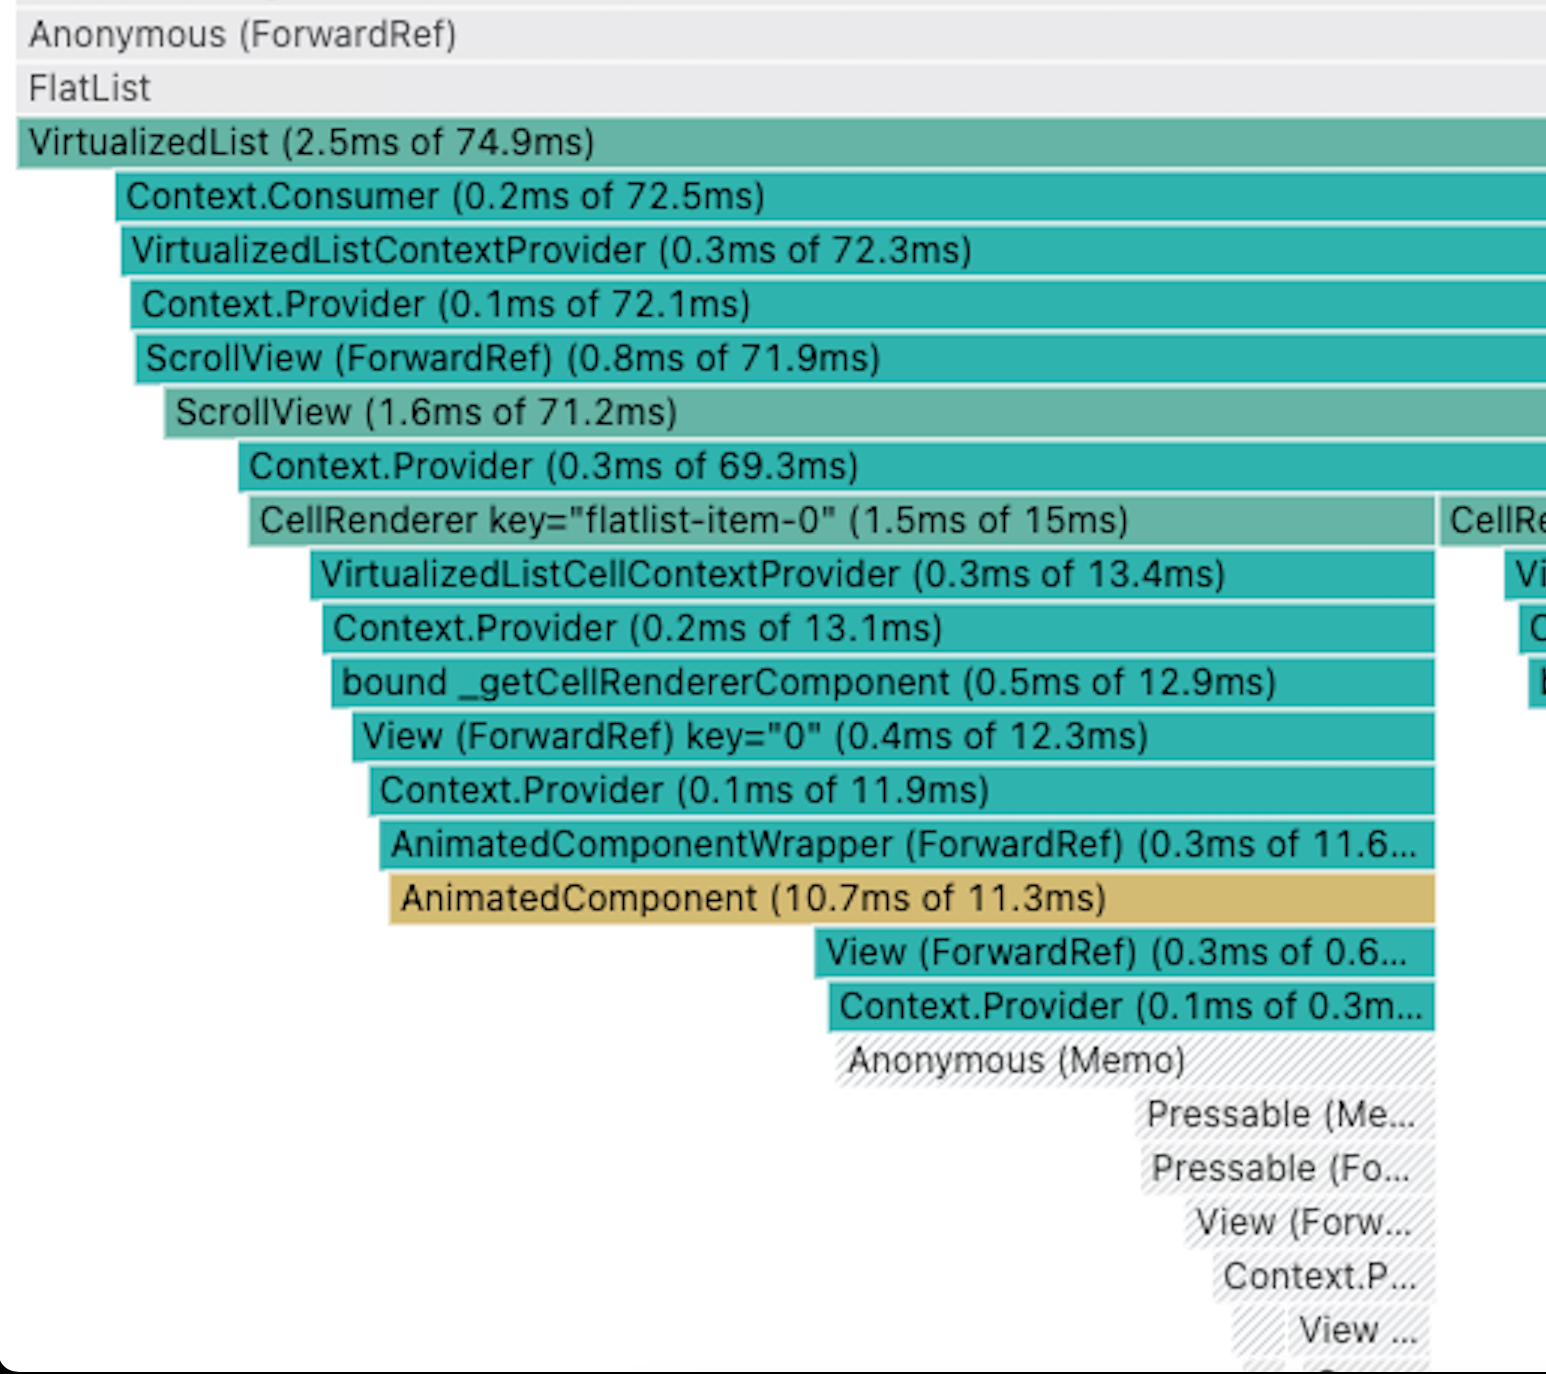
And we can see that this is costly to re-render. The ++code>AnimatedComponent++/code> highlighted in yellow especially indicate that this component in particular took a lot more time to render compared to their children.
++code>react-native-snap-carousel++/code> adds this ++code>AnimatedComponent++/code> between the ++code>renderItem++/code> of the virtualized list and the actual item we provide. So even if we memoize our item, this ++code>AnimatedComponent++/code> will still be re-rendered since ++code>react-native-snap-carousel++/code> doesn't memoize it (and it should)
We have 2 solutions then.
The first one is to patch ++code>react-native-snap-carousel++/code> and add the memoization ourselves.
The second one is to wonder if we need virtualization on our carousel in the first place.
Remember, all this is happening because the virtualization list context is causing nested list to rerender. The lesson here is having nested lists can be tricky to handle, performance-wise. Can we avoid it then?
The answer for us is YES. By default a virtualized list will render enough item to fill 21. So for our horizontal lists of 4 items, virtualization actually has no benefits!
We eventually decided to rewrite the carousel ourselves using a ++code>ScrollView++/code> . It's not as complex as I previously thought!
But note that ++code>react-native-snap-carousel++/code> also provides the option to disable virtualization with the prop ++code>useScrollView++/code>
And here, finally, all existing items are not re-rendered when scrolling down.
And you know what I want to do now ? Here comes the performance score:
Thanks to our Flipper plugin and the React Dev tools, we were able to bring considerable performance improvement to our app, with a performance score going from 40/100 to 90/100.
Let me know what improvement you bring to your apps with those tools! ?
If you have any questions about the Flipper plugin, feel free to ping me on Twitter or post a Github issue
I'm still dreaming about a having a tool on par with Lighthouse for the web, hopefully, this is making it closer. But there are still lots of things that could be done to perfect it, expect new improvements soon!


Le BAM Innovation Lab, pour rester à la pointe des dernières innovations tech et produit !


